Capture, Gyres, Lanternfish, Stormwater, Bay Area Hot Spots, Bag Bans

 Just months from now, significant trash reduction requirements will take effect around San Francisco Bay. The aim of the requirements is to keep refuse from local municipalities from entering the Estuary, and ultimately the ocean. In a Tuesday afternoon workshop, nine presenters detailed the Bay’s troubles with trash. They covered subjects ranging from how garbage contaminates the food chain to what local cities and counties are doing to stem this pollution-laden tide.
Janet Cox, who directs the San Francisco Estuary Partnership’s (SFEP) ambitious trash capture demonstration project, opened the session with highlights from the four-year run of the project, which ended in November. With $5 million in funds, the project installed 4,003 trash capture devices in more than 60 municipalities through a partnership with cities and counties, the San Francisco Bay Water Quality Control Board, and the Bay Area Stormwater Management Agencies Association (BASMAA). Trash capture devices prevent litter from accumulating on Bay shorelines, and lingering indefinitely in our seas.
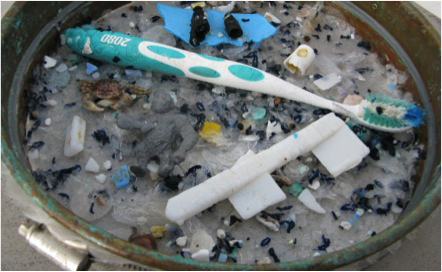
The trash that has already escaped into the ocean is being studied by 5Gyres, a nonprofit that conducts marine plastic pollution research and education. Since 2007, the organization has led 19 ocean voyages to the world’s five main oceanic gyres, circular currents that collect and trap trash. Of the 424 gyre surface water samples the organization has collected, 99 percent contained plastic. “What we mainly see is a plastic soup—water with suspended plastic bits—and not a plastic island or patch, as the media usually describes it,” said speaker Carolynn Box, an environmental coordinator for 5 Gyres. The organization aims to map the density and distribution of plastic particles within the gyres. In some instances they’ve documented as many as 400,000 particles of plastic per square kilometer. 5 Gyres will participate in multiple research projects in 2014, including partnering with the California Water Board and BASMAA to evaluate techniques to measure trash in storm drains, streams, and rivers, in San Francisco Bay and the Los Angeles region.
The Environmental Protection Agency’s region 9 (Pacific Southwest) staff have studied how such bits of ocean plastic affect the health of marine life. Contaminants in water are pervasive worldwide. A study by Tokyo University concluded that many pollutants have a propensity to hyperaccumulate on plastic bits at concentrations 1,000 to 1 million times higher than in surrounding seawater. While marine animals are harmed when they eat plastics, scientists are now more concerned that plastics serve as vectors for toxic chemicals to enter the food chain. EPA region 9 staff, partnering with the state’s Office of Environmental Health Hazard Assessment, tested this idea by analyzing the tissues of lanternfish (Myctophidae) for chemicals associated with plastics. This ubiquitous group of fishes is a common meal for other marine life. Lanternfish also eat zooplankton in the upper water column, where plastic particles and trash accumulate. In samples from all 280 fishes tested, the study found traces of one or more plastic chemicals including bisphenol A (BPA), a common form of hard plastic; alkylphenols (AP), additives in plastics; and polybrominated diphenyl ethers (PBDEs), which are found in flame retardants.
The ability of plastics to dose fish with contaminants was supported by a second study conducted at UC Davis. Scientists compared the tissues of Japanese killifish, or medaka (Oryzias latipes) fed diets of fishmeal that were augmented with 10 percent virgin plastic, 10 percent marine contaminated plastic, or uncontaminated. Within two months, the fish in the marine plastics group showed higher levels of PBDEs, polycyclic aromatic hydrocarbons (PAHs), and polychlorinated biphenyls (PCBs); the latter are both considered human carcinogens. When the group fed pure fishmeal also turned out to be contaminated, researchers learned that the high-quality fishmeal food contained cod liver oil, which is contaminated with PCBs. “There’s a synergistic effect between common ocean pollutants and their transfer via plastic into marine life,” said speaker Anna-Marie Cook, regional coordinator for EPA Region 9’s marine debris program. “It’s a toxic cocktail and a huge problem waiting for us to come up with answers.”
Part of the solution is to limit the amount of trash reaching waterways. The Bay Area has taken an aggressive step in that direction. By June of 2014, all large municipalities in the Bay Area must cut the amount of trash entering local waterways by 40 percent. The new trash reduction requirements are a stipulation of the Municipal Regional Stormwater Permits issued by the San Francisco Bay Regional Water Quality Control Board. Cities must further reduce the volume of trash in stormwater by 70 percent in 2017 and 100 percent in 2022. Top of mind for everyone is how compliance will be measured. Speaker Dale Bowyer of the SF Bay Regional Water Board said identifying and monitoring the progress of areas that generate large amounts of trash will be crucial, as will on-land assessment of trash and, eventually, measurement of trash directly in water.
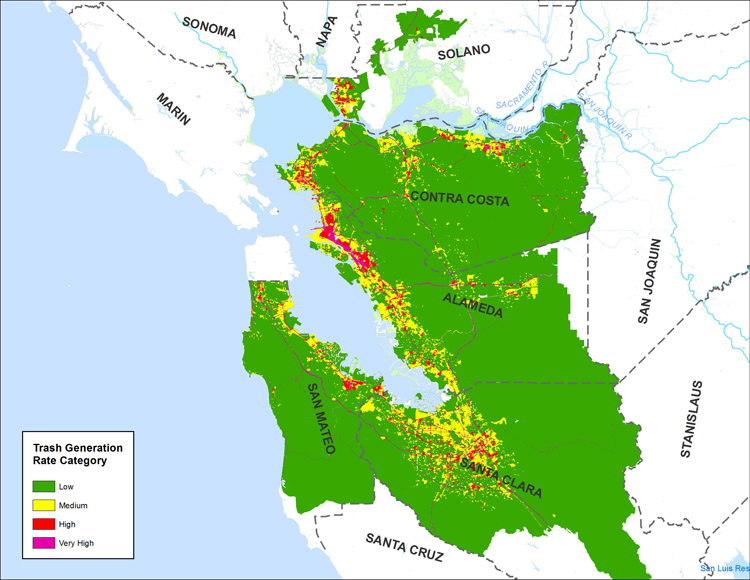
Speaker Chris Sommers with the engineering consulting firm EOA, Inc. analyzed 61 factors such as population demographics and land use as part of his analysis of the Bay Area’s garbage problem. Sommers then created a trash-generation map which shows that the areas producing the most trash are residential and retail sections of low-income neighborhoods. The analysis determined that roughly 35 percent of the urban portion of the Bay Area likely needs attention, said Sommers. The other 64 percent of urban areas generate very low levels of trash and litter.
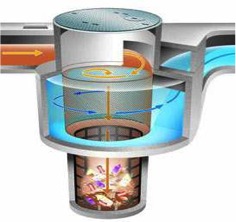
Oakland faces many of the challenges Sommers’ described: 42 percent of its housing is high-density, 60 percent of its population are renters, and 18 percent of its residents live in poverty. The city has installed 12 capture devices, which resemble giant cylinders with mesh bottoms, in strategic areas such as catchment basins to capture runoff from a maximum number of acres. The >$2.9 million project collects water from 900 acres. Most of the devices are 25 feet underground and measure four feet in diameter and 19 feet deep. When the units are cleaned every six months, they have yielded up to 12 cubic yards of trash. Despite the large quantity of trash diverted from the Bay thus far, “we have a long way to go to [reach] 100 percent,” said speaker Rebecca Tuden, a watershed specialist for the City of Oakland. A disadvantage of these units is that the trash capture is not visible to the community. Oakland is also looking at other trash reduction measures, too, such as street sweeping five days a week in high trash areas.
Plastic bag bans are another popular tool for achieving the mandatory trash reductions. Napp Fukuda, deputy director of San Jose’s environmental services department, discussed the city’s successful ban almost two years after its implementation. “As the third largest city in California, and with a population of almost a million,” said Fukuda, “dealing with trash is a big challenge, but we also see it as an opportunity.” The city’s plastic bag ban affects 5,000 retail businesses and imposes a 10 cent fee for paper bags. Fukuda said his department has observed 98 percent compliance among businesses. In the meantime, the percentage of consumers bringing reusable bags increased from 4 percent to 62 percent, while 43 percent of shoppers now use no bag. The city has also observed a 59 percent decrease in street litter. San Jose’s latest plastic-reduction step is a ban on styrofoam takeout containers. The ban goes into effect January 2014 for large multi-state restaurants, and a year later for all other restaurants.
In a similar effort, Alameda County implemented a plastic bag ban just under a year ago, requiring a 10-cent fee for paper bags and plastic reusable bags. The ordinance affects 1,500 businesses, including supermarkets, grocery, convenience, drug, and liquor stores. Stopwaste, the public agency dedicated to reducing the county’s waste stream, is shepherding the effort. Presenter Meri Soll, a program manager with agency, said that initial anecdotal data is positive based on inspections of 250 stores.
Another city strategy—transforming a trash hotspot into a public good—was described by Rinta Perkins, stormwater program manager for the City of Walnut Creek. A section of the city’s namesake waterway had become an illegal dumping ground and homeless encampment. With $400,000 of city and grant money, the city built a pedestrian path along the creek with signs describing the local habitat and advocating pollution prevention, as well as a pesticide-free demonstration garden. Volunteers conduct annual creek cleanups and remove invasive species. The effort has yielded a 68 percent reduction in trash in the area. With the help of partner organizations, more than 700 people and students have been educated about watershed stewardship through guided tours and outdoor watershed classrooms. “[At] what was once an abandoned site,” said Perkins, “we now see people all over.”
Trash Capture
San Jose Trash Summit
Regulating Trash in Stormwater
StopWaste
[toggle_box]
[toggle_item title=”PowerPoint Gallery” active=”false”]


By Ariel Rubissow Okamoto
Nothing could be stranger than sitting in the dark with thousands of suits and heels, watching a parade of promises to decarbonize from companies and countries large and small, reeling from the beauties of big screen rainforests and indigenous necklaces, and getting all choked up.
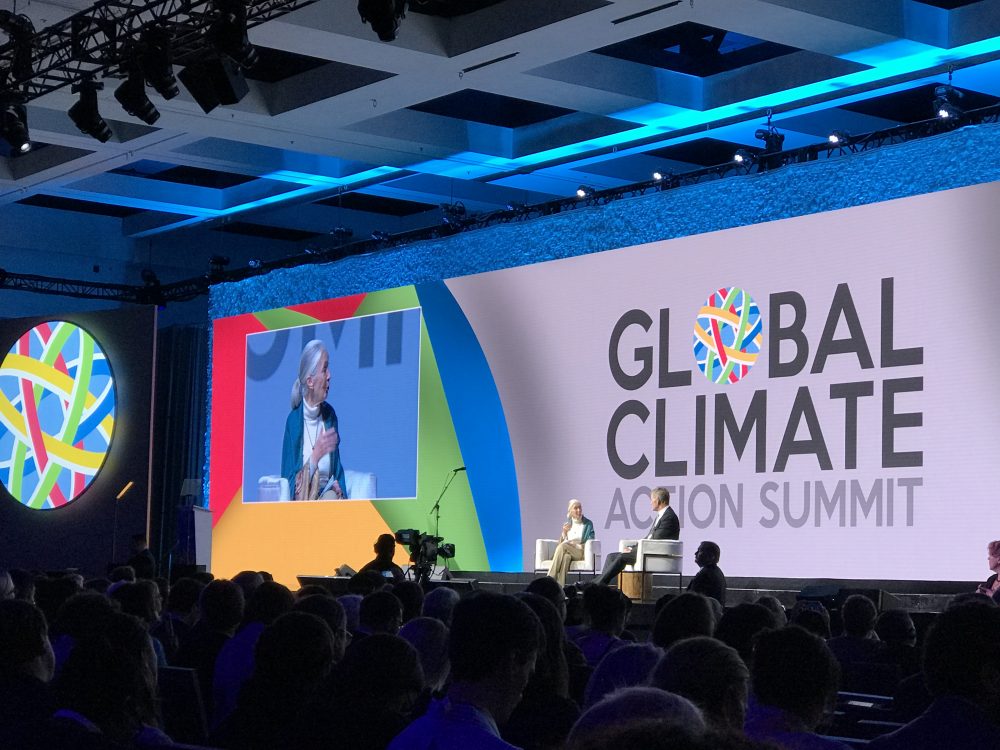
It was day two of the September 2018 Global Climate Action Summit in San Francisco when I felt it.
At first I wondered if I was simply starstruck. Most of us labor away trying to fix one small corner of the planet or another without seeing the likes of Harrison Ford, Al Gore, Michael Bloomberg, Van Jones, Jerry Brown – or the ministers or mayors of dozens of cities and countries – in person, on stage and at times angry enough to spit. And between these luminaries a steady stream of CEOs, corporate sustainability officers, and pension fund managers promising percentages of renewables and profits in their portfolios dedicated to the climate cause by 2020-2050.
I tried to give every speaker my full attention: the young man of Vuntut Gwichin heritage from the edge of the Yukon’s Arctic National Wildlife Refuge who pleaded with us not to enter his sacred lands with our drills and dependencies; all the women – swathed in bright patterns and head-scarfs – who kept punching their hearts. “My uncle in Uganda would take 129 years to emit the same amount of carbon as an American would in one year,” said Oxfam’s Winnie Byanyima.
“Our janitors are shutting off the lights you leave on,” said Aida Cardenas, speaking about the frontline workers she trains, mostly immigrants, who are excited to be part of climate change solutions in their new country.
The men on the stage, strutting about in feathers and pinstripes, spoke of hopes and dreams, money and power. “The notion that you can either do good or do well is a myth we have to collectively bust,” said New Jersey Governor Phil Murphy whose state is investing heavily in offshore wind farms.
“Climate change isn’t just about risks, it’s about opportunities,” said Blackrock sustainable investment manager Brian Deese.
But it wasn’t all these fine speeches that started the butterflies. Halfway through the second day of testimonials, it was a slight white-haired woman wrapped in an azure pashmina that pricked my tears. One minute she was on the silver screen with Alec Baldwin and the next she taking a seat on stage. She talked about trees. How trees can solve 30% of our carbon reduction problem. How we have to stop whacking them back in the Amazon and start planting them everywhere else. I couldn’t help thinking of Dr. Seuss and his truffala trees. Jane Goodall, over 80, is as fierce as my Lorax. Or my daughter’s Avatar.
Analyzing my take home feeling from the event I realized it wasn’t the usual fear – killer storms, tidal waves, no food for my kids to eat on a half-baked planet – nor a newfound sense of hope – I’ve always thought nature will get along just fine without us. What I felt was relief. People were actually doing something. Doing a lot. And there was so much more we could do.
As we all pumped fists in the dark, as the presentations went on and on and on because so many people and businesses and countries wanted to STEP UP, I realized how swayed I had let myself be by the doomsday news mill.
“We must be like the river, “ said a boy from Bangladesh named Risalat Khan, who had noticed our Sierra watersheds from the plane. “We must cut through the mountain of obstacles. Let’s be the river!”
Or as Harrison Ford less poetically put it: “Let’s turn off our phones and roll up our sleeves and kick this monster’s ass.”
by Isaac Pearlman
Since California’s last state-led climate change assessment in 2012, the Golden State has experienced a litany of natural disasters. This includes four years of severe drought from 2012 to 2016, an almost non-existent Sierra Nevada snowpack in 2014-2015 costing $2.1 billion in economic losses, widespread Bay Area flooding from winter 2017 storms, and extremely large and damaging wildfires culminating with this year’s Mendocino Complex fire achieving the dubious distinction of the largest in state history. California’s most recent climate assessment, released August 27th, predicts that for the state and the Bay Area, we can expect even more in the future.
The California state government first began assessing climate impacts formally in 2006, due to an executive order by Governor Schwarzenegger. California’s latest iteration and its fourth overall, includes a dizzying array of 44 technical reports; three topical studies on climate justice, tribal and indigenous communities, and the coast and ocean; as well as nine region-specific analyses.
 The results are alarming for our state’s future: an estimated four to five feet of sea level rise and loss of one to two-thirds of Southern California beaches by 2100, a 50 percent increase in wildfires over 25,000 acres, stronger and longer heat waves, and infrastructure like airports, wastewater treatment plants, rail and roadways increasingly likely to suffer flooding.
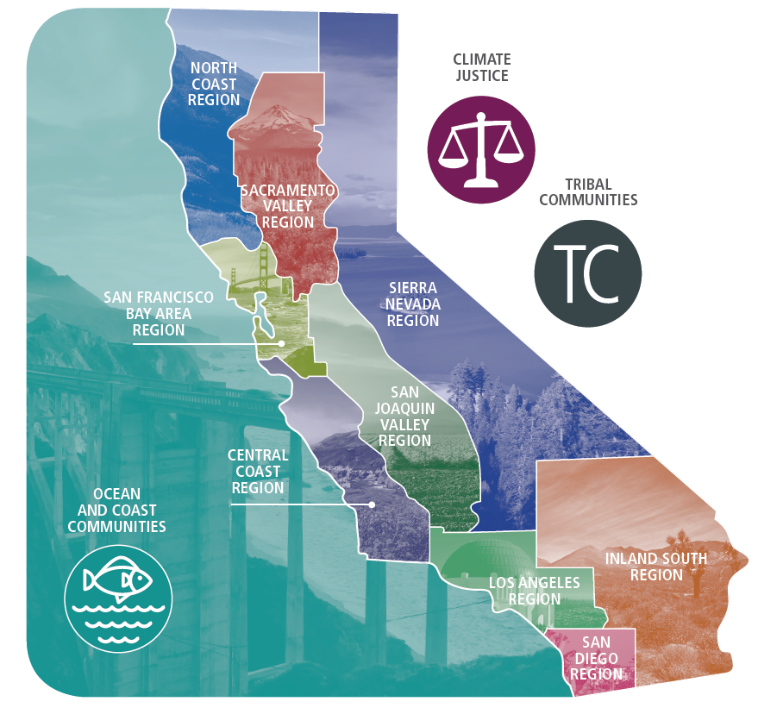
For the first time, California’s latest assessment dives into climate consequences on a regional level. Academics representing nine California regions spearheaded research and summarized the best available science on the variable heat, rain, flooding and extreme event consequences for their areas. For example, the highest local rate of sea level rise in the state is at the rapidly subsiding Humboldt Bay. In San Diego county, the most biodiverse in all of California, preserving its many fragile and endangered species is an urgent priority. Francesca Hopkins from UC Riverside found that the highest rate of childhood asthma in the state isn’t an urban smog-filled city but in the Imperial Valley, where toxic dust from Salton Sea disaster chokes communities – and will only become worse as higher temperatures and less water due to climate change dry and brittle the area.
According to the Bay Area Regional Report, since 1950 the Bay Area has already increased in temperature by 1.7 degrees Fahrenheit and local sea level is eight inches higher than it was one hundred years ago. Future climate will render the Bay Area less suitable for our evergreen redwood and fir forests, and more favorable for tolerant chaparral shrub land. The region’s seven million people and $750 billion economy (almost one-third of California’s total) is predicted to be increasingly beset by more “boom and bust” irregular wet and very dry years, punctuated by increasingly intense and damaging storms.
Unsurprisingly, according to the report the Bay Area’s intensifying housing and equity problems have a multiplier affect with climate change. As Bay Area housing spreads further north, south, and inland the result is higher transportation and energy needs for those with the fewest resources available to afford them; and acute disparity in climate vulnerability across Bay Area communities and populations.
“All Californians will likely endure more illness and be at greater risk of early death because of climate change,” bluntly states the statewide summary brochure for California’s climate assessment. “[However] vulnerable populations that already experience the greatest adverse health impacts will be disproportionately affected.”
“We’re much better at being reactive to a disaster than planning ahead,” said UC Berkeley professor and contributing author David Ackerly at a California Adaptation Forum panel in Sacramento on August 27th. “And it is vulnerable communities that suffer from those disasters. How much human suffering has to happen before it triggers the next round of activity?”
The assessment’s data is publicly available online at “Cal-adapt,” where Californians can explore projected impacts for their neighborhoods, towns, and regions.