It’s a cold morning in early February, and Chris Vallee of
the U.S. Geological Survey is motoring upriver along Steamboat Slough. His
two-man crew is hunched in the bow with backs to the wind, wrapped to the ears
in water-resistant jackets above warm layers. Vallee pilots the vessel in
relative comfort behind the shelter of the windscreen.
The boat passes the usual Delta sights: greenish-brown water
drifting past road-crowned levees, the occasional dock and house, a greater
egret the color of alabaster lifting off from a eucalyptus branch. After
glancing periodically at the open laptop perched on his console, which displays
a GPS map of our destination waypoints, Vallee turns the bow toward shore.
The bank is armored with riprap and sheltered by a few
trees. As we nose up to dry land, hydrologic technicians Norbert “Nubs” VandenBranden
and Ryan Johnson scramble ashore, feeling with bare hands for the steel cable
they know is tucked beneath the rocks. After detaching the cable from a nearby
tree with leg-length bolt cutters, both hop back into the boat.
Vallee and his team are here to maintain an array of
hydrophones used to track migrating native fish. The work is part of a
multi-agency effort to provide more timely and detailed information about the
movements of salmon, steelhead, and sturgeon in the Central Valley. Deploying
hundreds of listening stations across the watershed, the program lets
scientists follow thousands of tagged fish as they navigate from hatcheries and
headwater streams toward the Pacific Ocean.
Confluence of Steamboat Slough, Cache Slough, and Sacramento River. Photo: Myfanwy Johnston.
The goal of the program is to keep migrating fish safer
while continuing to supply water to San Joaquin farmers and Southern California
cities. Whether this relatively new technology ultimately helps conserve native
fish populations remains to be seen.
As Vallee maneuvers the boat back toward the center of the
channel, VandenBranden and Johnson hook the cable to a winch. Soon, a triangular
metal frame rises from the depths. They ease the dripping hulk into the bow,
and set to work swapping out the white plastic cylinder bolted to its center: a
hydrophone.
Vallee types the ID number of the receiver, now stowed
carefully on deck, into the computer, and a fresh instrument gets lowered into
the water. A few checks to make sure the hydrophone is located and oriented
correctly, and they move on to the second receiver at this site. The four
receivers here form two acoustic “gates” able to hear the high-frequency sound
emitted by a tagged fish no matter where it’s located along this cross section
of the channel.
The team moves with the smooth efficiency of long practice,
communicating with few glances and fewer words. It’s no wonder: they revisit
these autonomous receivers every three months to install units with fresh
batteries and download their fish detection data.
The USGS is responsible for 80 to 100 receivers positioned
at key junctions along Delta waterways. But the agency was visiting this site
and others long before the fish telemetry program existed. The USGS has mounted
its receivers adjacent to equipment that tracks water quality characteristics
such as water level, flow, salinity, temperature, and turbidity. That’s because
layering velocity, discharge, and water quality data atop tagging information
adds tremendous scientific value.
“It gives us a lot better information to pass on to water
managers for what conditions are ideal for fish, and on the flip side what
conditions are lethal,” says UC Santa Cruz fisheries biologist Cyril Michel,
part of the large team collaborating on salmon tracking. For example, several
studies have shown that higher flows in the river and Delta seem to be the
strongest predictor as to whether fish survive that first migration to sea.
That’s good news for fish, according to Michel. “We have the
ability to increase survival of fish if the right decisions are made. We have
the levers to control the water that comes down the river.”
“Everyone wants more water, but fish are the regulatory
constraint on the water flows we have,” Vallee says.
Video: Kathleen M. Wong
From fin snips to fish blips
The ability to follow fish on their watery travels is the
realization of a long-held dream for biologists. The paths fish hatchlings take
to reach the Golden Gate, the length of their journey to the ocean, and even
the likelihood of a new fry surviving the journey have all long been a mystery.
Over the decades, methods of marking fish for tracking have
undergone a sea change. Fin snips were the first method used to distinguish
hatchery-born from wild fish. Then, in the 1960s, scientists came up with the
idea of also injecting smolts with a sliver of wire etched with a code
revealing where and when the fish was born. Traps and trawls were set up at
spots downstream to recapture tagged fish. Any fish with snipped fins had its
head chopped off and taken back to the lab, where scientists could prise out
and read the tag.
But coded wire tags gave limited information. “The recapture
rate was only a tenth of a percent. At this rate it took about 20 years to
start to get meaningful results,” says Russ Perry, a USGS research fish
biologist.
Nor did wire tags reveal the routes fish took to get to a
capture site. “We might see high mortality between the Red Bluff Diversion Dam
and the Chipps Island trawl [opposite Pittsburg], but we didn’t necessarily
know where that occurred,” says Michel.
In the mid-2000s, technology that made WiFi and cell phones
possible began to transform fish tracking. Tags got small enough to fit inside
the belly of a juvenile salmon. When a tagged fish swims past a listening
station, the receiver automatically logs its tag number.
Over the past 15 years, the practice of acoustic telemetry
has changed from small-scale use for basic science research to large-scale use
by professional agency scientists to guide management decisions. On the order
of 20,000 fish have been released since the technology first became available.
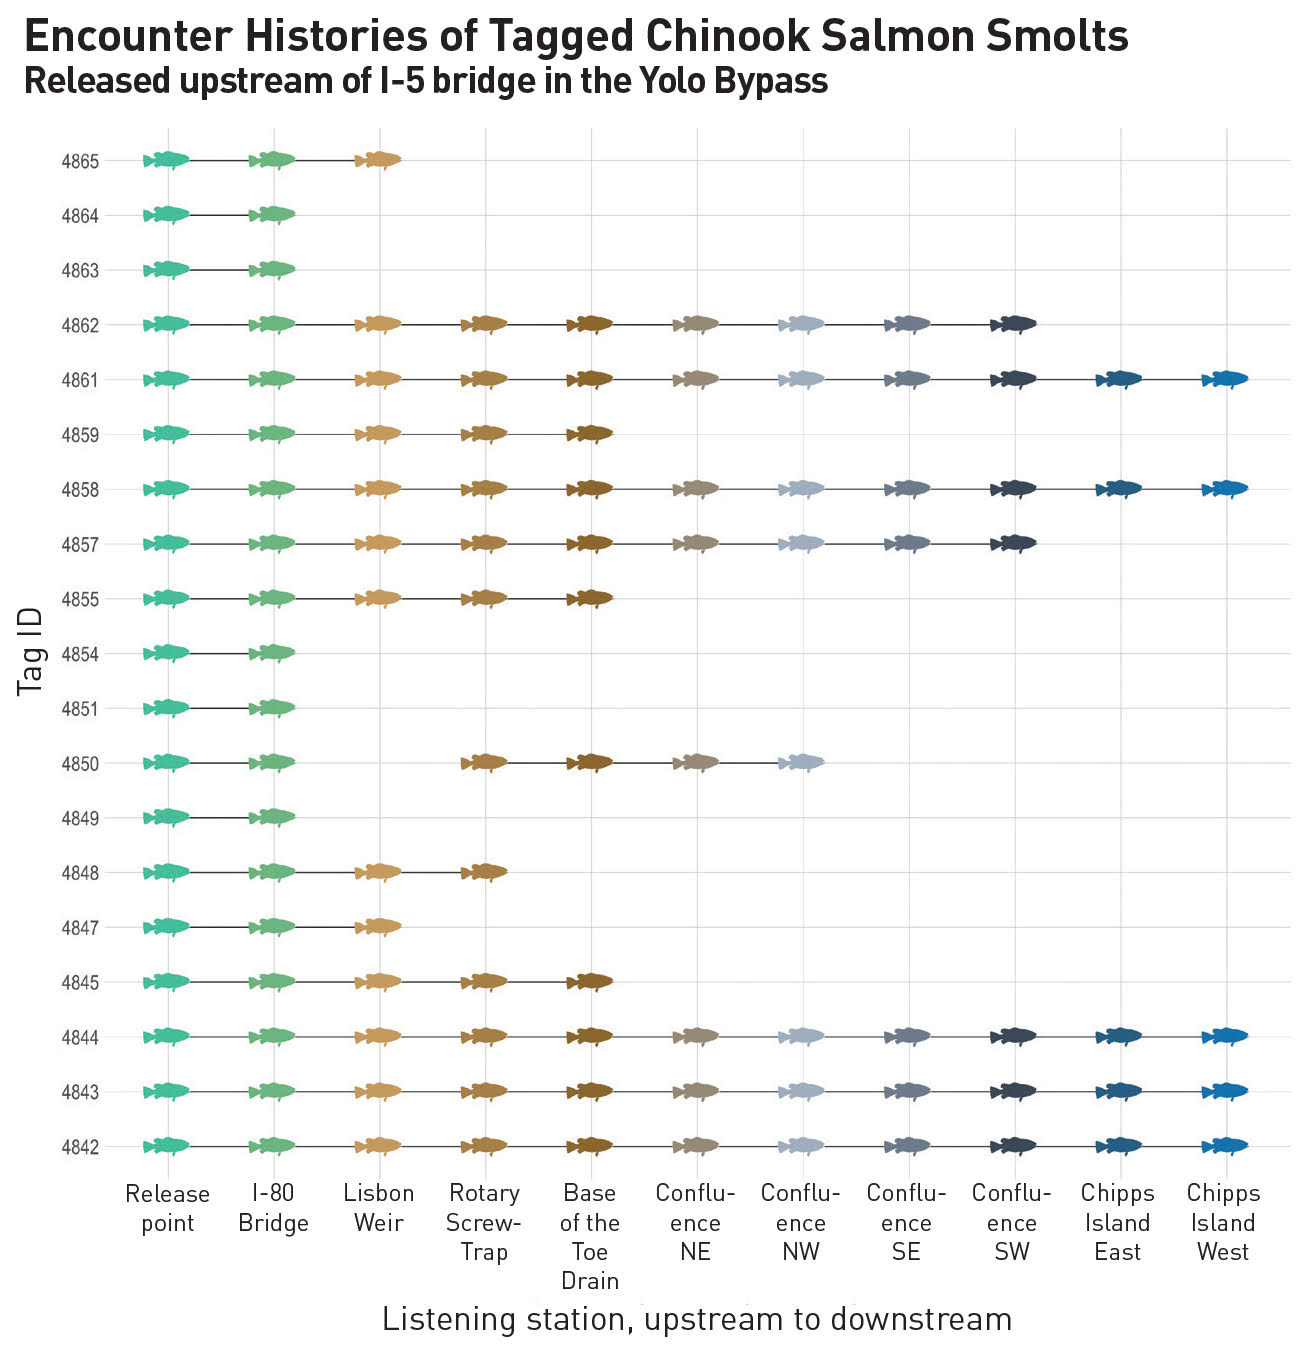
Source: Myfanwy Johnston
Real-time receivers are the latest improvement in the world
of fish tracking. Connected to a modem, these devices upload detections as they
are received to an online database. The data is instantly available and free
for anyone to download from the online portal Cal Fish Track.
“The fish swims by, and through the beauty of cell
technology you can see on the website the fish survived to be detected there,”
says Rachel Johnson, a research fish biologist with NOAA.
Real-time data promises to enable water managers to adapt
their operations based on the season’s fish detections. “This is one of the
most exciting parts of the program — the ability for us to collect information
in real time and translate the information [into something that helps us]
understand if there’s an effect from management choices,” says Josh Israel, a
fish biologist with the U.S. Bureau of Reclamation.
Many scientists view real-time as a major advance over
autonomous receivers, which must be hauled out of the water to have their data
downloaded every few weeks. “A lot of that information is generated on
timelines not necessarily reflecting agency needs,” Israel says.
The era of cooperation
Scientists from all the major fish tracking and water
agencies are now working together to build an acoustic telemetry network
offering broader and more detailed coverage of the Central Valley watershed.
The Interagency Telemetry Advisory Group, or ITAG, met for the first time in
August of 2018. The member list reads like a who’s who of fish research and
water management in the region: California Department of Fish and Wildlife,
National Oceanic and Atmospheric Administration, California Department of Water
Resources, UC Santa Cruz, UC Davis, U.S. Army Corps of Engineers, U.S. Bureau
of Reclamation, U.S. Fish and Wildlife Service, U.S. Geological Survey.
“It’s been easy for agencies to support this because ITAG is
focused on creating the kind of information that can be used for fisheries and
water management,” says Israel, who co-chairs the group. “ITAG is a big
backbone that can support both basic research and investigations into a variety
of questions.”
Much
of the funding for ITAG coordination has come through Israel’s employer, the
U.S. Bureau of Reclamation. The bureau plays a major role in dam operations and
water deliveries in California. Other state and regional investors include the
Delta Stewardship Council, whose managers want to see continued advances in
science coordination, synthesis and communication.
“We have
repurposed the telemetry data to describe broad patterns in outmigration and
life history diversity for salmon,” says Pascale Goertler, a Delta Stewardship
Council scientist who has synthesized 10 years of telemetry data. Her project
helped illuminate ITAG’s data integration needs. “We want to understand how
juvenile salmon navigate the risks and rewards of freshwater residency under
changing conditions.”
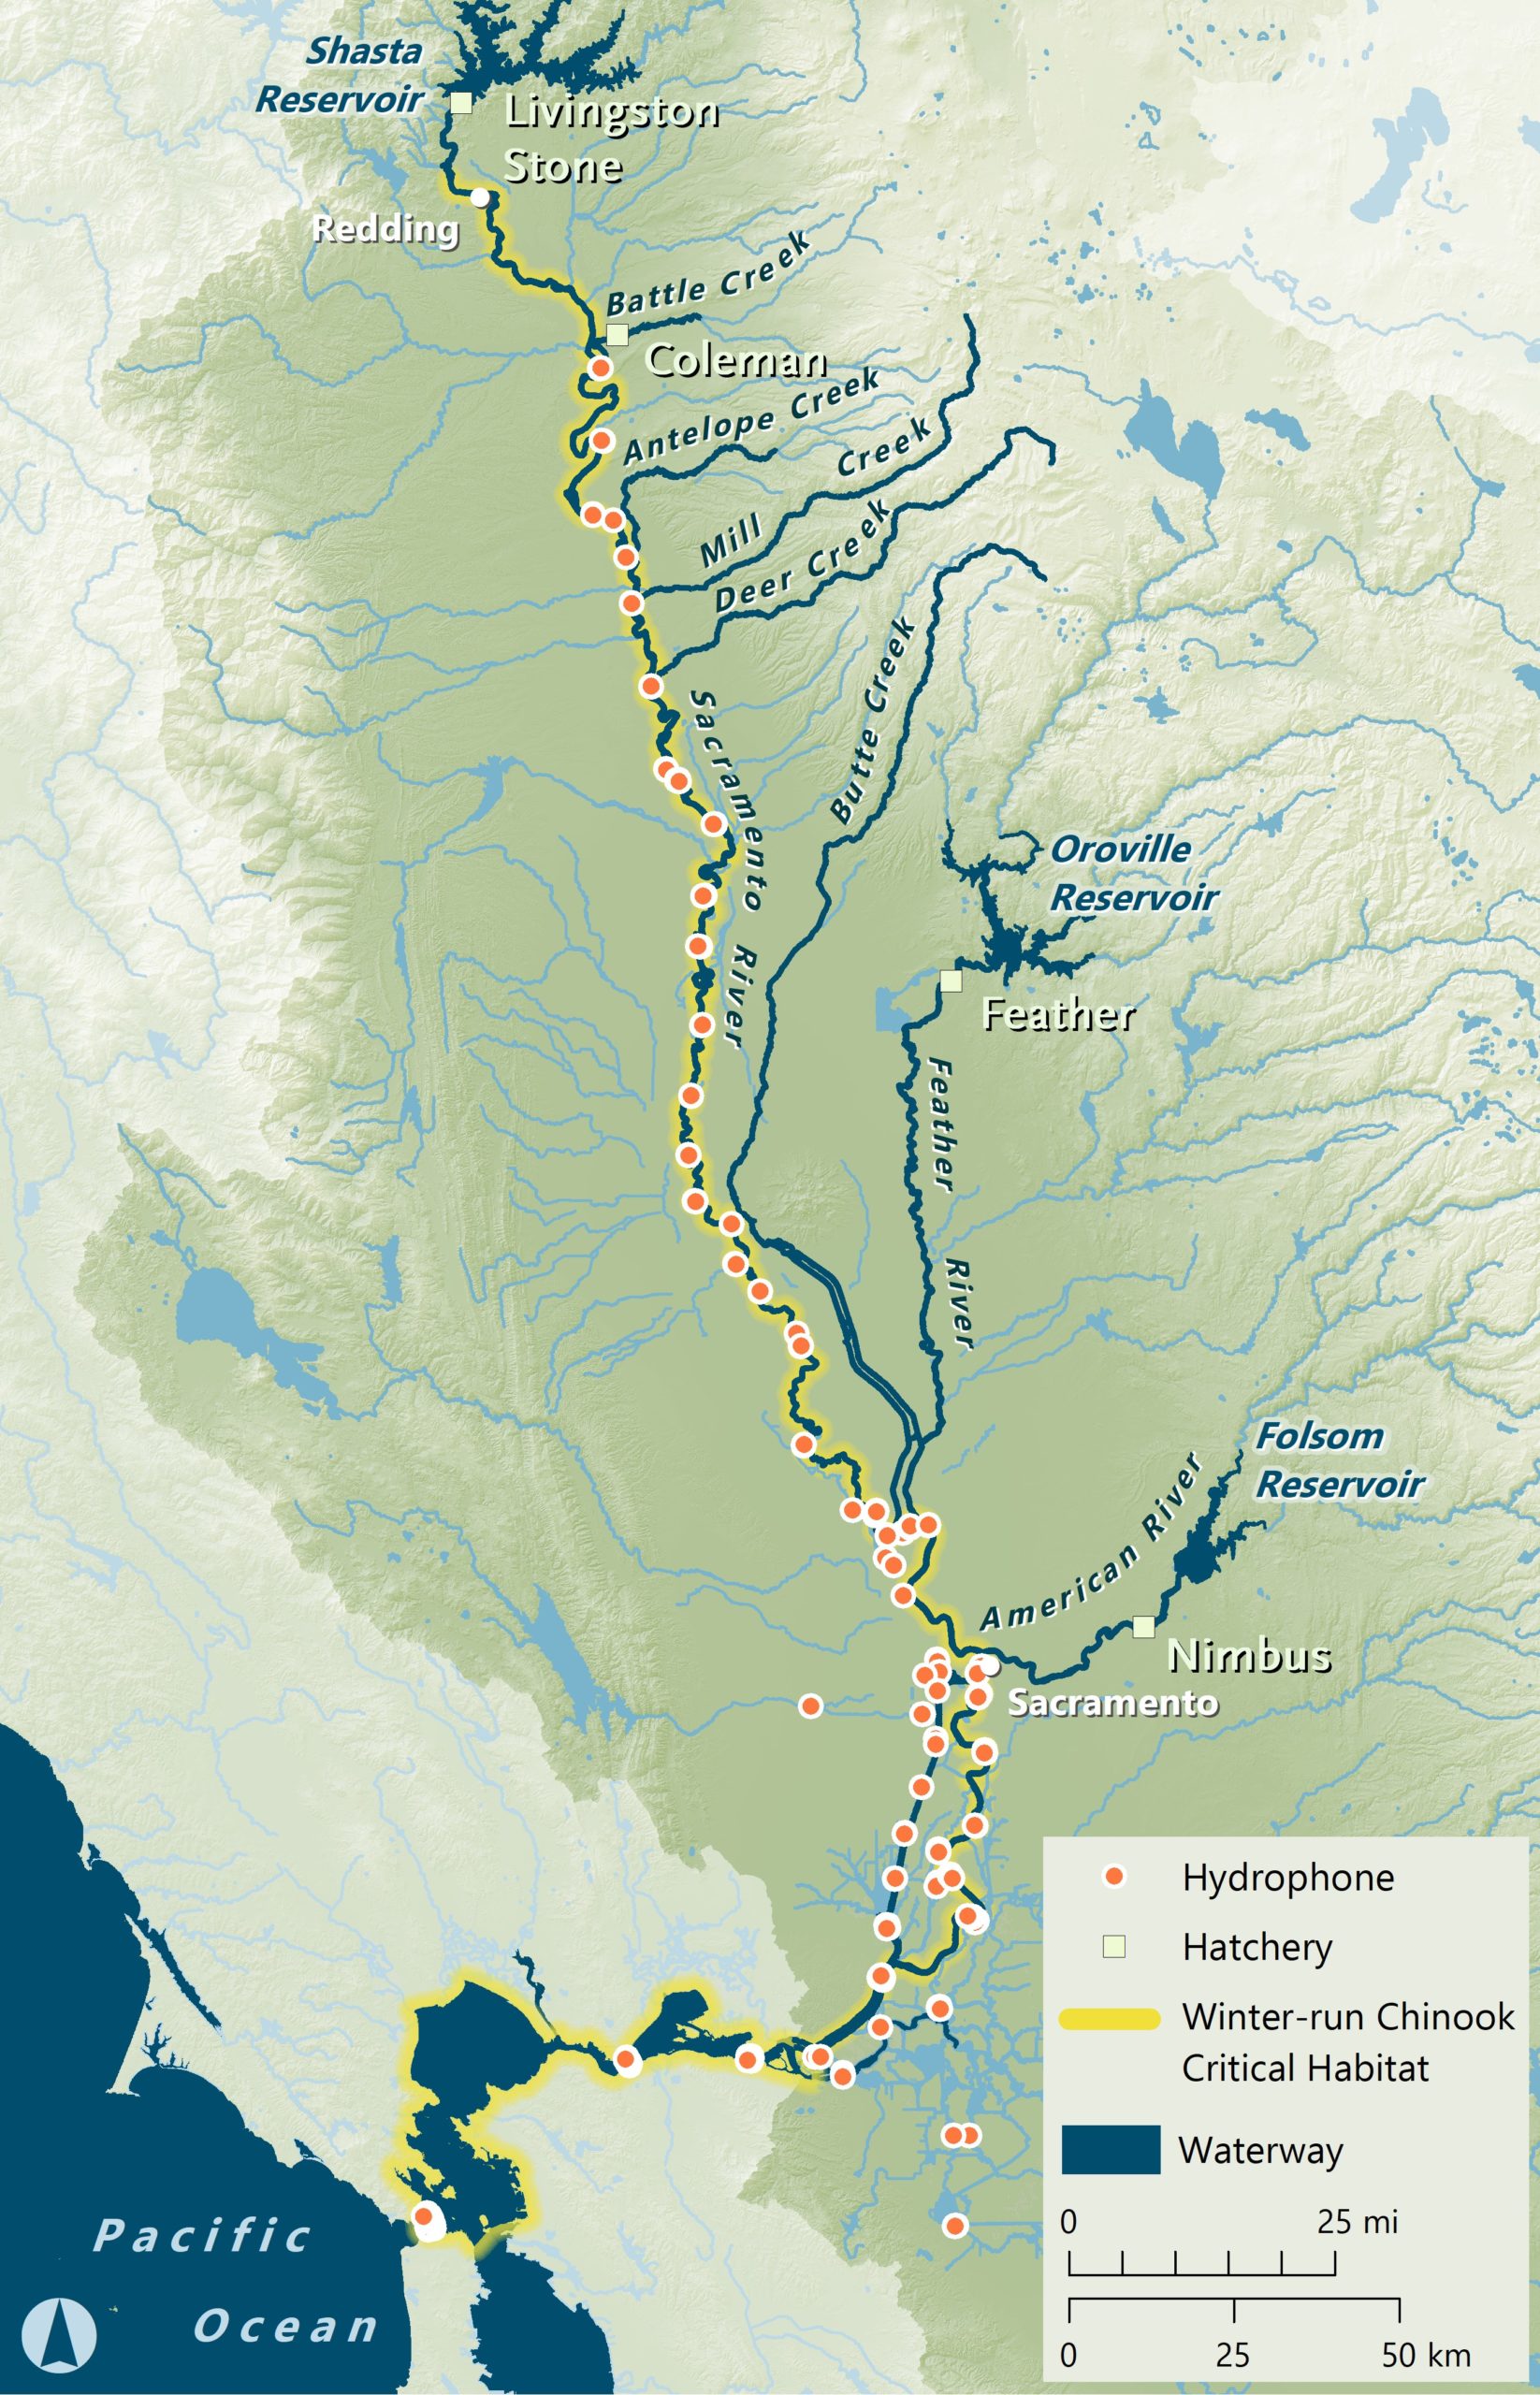
Fishing listening stations along the Sacramento River, Northern California. Map: Amber Manfree
ITAG has made major progress in its year and a half of
existence. Participants are now using compatible equipment. Duplicate tag
numbers, where two different fish had the same number because different
agencies were tracking them, are a thing of the past. All receivers in the
network recognize all participants’ tags, producing more detections across the
watershed. Care and maintenance of the receivers is divvied up among the
participants. All agencies are now using the same river mile designations,
making it easier to find and service receivers.
“It’s a great idea, and it’s working very well. I can see it
in the way people help each other,” says Flora Cordoleani, a fish biologist for
NOAA as well as an ITAG facilitator. For example, she says, participants are
now willing to lend gear or replacement parts.
Everyone wants to contribute as best they can because people
want to ensure the agencies have the best information,” Israel says.
ITAG also organizes workshops to teach protocols for
inserting tags as well as estimating survival and movement rates from the
detection data. Unified by ITAG, scientists are now implanting acoustic tags by
the thousands in fish runs of interest in the Central Valley, more specifically
7,200 green sturgeon, Chinook, and steelhead in 2020.
Advancing the science
There’s no denying that native fish, particularly salmon,
need all the help they can get. A juvenile salmon born in a headwaters stream
has just a 3 percent chance of making it through the Central Valley and out to
the Golden Gate. In many years, a larger proportion die within the weeks they
spend outmigrating than during the whole one to three years they spend in the
ocean.
“Survival for Central Valley salmon is terrible,” Michel
says.
Acoustic telemetry data has the potential to improve
conditions for fish by giving scientists new insights into their habits. Tagged
fish are released in groups of hundreds of animals apiece to answer specific
questions. The routes fish take can reveal everything from the progress of a
run of interest to how fish react to infrastructure like gates, screens, and
pumps, or certain water conditions.
These insights could be used to nudge fish away from danger
zones and toward better habitat. For example, researchers have found salmon
grow larger and faster in the Yolo Bypass. Learning how salmon ply the waters
near the bypass’ Fremont Weir entrance will help engineers design a gate to
pull fish into this fishy Eden.
Animation: Myfanwy Johnston
Simulated salmon runs
Right now, scientists’ best guess about how a given fish
group’s migration will play out comes from the Delta STARS model. This computer
simulation predicts where fish will go, and how fast, under given water
operation conditions. The model lets scientists and managers release virtual
fish at the top of the Delta. River flow and channel information helps the
model fill in the details through eight segments of the watershed.
USGS biologist Russ Perry based the model on five years of
acoustic tag data from late-fall-run Chinook. “That predictive model basically
would be impossible if it weren’t for this amazing network of telemetry
receivers and acoustic tag releases over a number of years,” he says.
The model lets managers break down how components such as a
given route or water conditions affect chances of survival. “You can look at
the differences between scenarios and understand whether one is better or
worse,” Perry says.
NOAA Fisheries has already used Delta STARS to evaluate the
effects of the California WaterFix plan on fish, while the USBR and DWR used it
to study potential fish impacts from proposed operations changes to the Central
Valley Project and State Water Project.
Perry is now using telemetry information from winter and
spring runs to build more flavors of the model for those imperiled stocks.
“It’s really exciting to have the acoustic telemetry data
get to a state where it’s informing models that affect the management of
natural and water resources,” Perry says.
Video: Russell Perry, USGS & Kathleen M. Wong
The costs of tracking
New knowledge from acoustic tagging comes at high cost. Each
autonomous acoustic receiver currently costs up to $6,500. Real-time receivers
cost even more due to the need for solar panels for power and communications
links. The fish tags can run a few hundred dollars apiece. Multiply this by
dozens of receivers and thousands of tags, and the bill for the equipment runs
into the millions of dollars.
Then there’s the need to refresh the equipment as improvements
come along, the same way businesses must keep their computers and other
equipment current. Right now, most of the network’s receivers are two or three
years old. Plans are to upgrade the system every five years or so.
As advanced as it seems, the technology severely limits
which fish can be tracked. Current tag designs are too large for many juvenile
fish. Smolts must be at least 80 millimeters long to accommodate a tag.
“We’re looking via telemetry at only the largest size class
of juvenile salmon emigrating through the Delta,” Perry says. “The information
is amazing, but we have to keep in mind the other populations and life stages
out there when these different environmental conditions and water operations
are occurring.”
Questionable stand-ins
To simulate these other types of runs, hatchery smolts could
be tagged and released when the wild fish begin their migrations. “But then the
question is whether these fish are true surrogates for the population of
interest,” says Michel.
The lion’s share of tagged fish have always been from
hatcheries. Managers want to know how well these stalwarts of the commercial
and recreational salmon fisheries fare. In the case of the winter run, they
want to see whether wild fish are protected (the winter run is the most
endangered of the salmon runs). Tagged animals are released together with the
larger group of fish, and all mingle on their journey to the ocean. Yet many scientists
question how well hatchery-raised animals surgically altered to carry a tag
truly represent the behavior of untouched, wild-born salmon.
Hatchery fish are believed to have lower migration survival
rates than their wild brethren. After all, they’ve grown up in an environment
without predators, and no natural culling has occurred before release.
However, both hatchery and wild fish should respond
similarly to environmental conditions like flows, temperatures, or routes. So
using hatchery fish to make inferences about relative changes in survival due
to environmental conditions tends to be more sound than using them to infer
absolute values of survival, says Perry.
It could also be argued that tagging a fish as small as a salmon smolt may be invasive enough to alter the animal’s responses. Fish are poured into water laced with sedative, have their belly cut open with a scalpel, and get a tag poked into their abdominal cavity before being surtured back up again.
If a major reason for the telemetry effort is to help guide
water-delivery decisions, data from tagged hatchery fish might carry more
weight than it can scientifically bear.
USFW 2017
Seeing is believing
Around USGS they have a name for the instant eye candy that
can be seen so quickly onscreen when the telemetry yields detections: “one
fish, two fish, red fish, blue fish.”
Perry says managers must remain alive to the shortcomings of
the data, however. “It’s tempting to use the raw detections coming out of the
telemetry system,” he says. “But it has to be statistically analyzed first.”
These manipulations involve quality filtering of the data, as well as
calculations that can add in measures such as of the number of tagged survivors
that evaded detection.
In fact, scientists say acoustic tagging should be
considered just one of many sources of information used to inform water
management, along with trawl and screw trap data, fish surveys, and historical
trends.
“There’s a worry that when people see pretty dots on a
screen, they interpret that as understanding, but it’s only raw material,” says
Steve Culberson, lead scientist for the Interagency Ecological Program. “What
I’m more concerned about is that we will collect all this data but not invest
in the intellect— the seats we need to fill—to ingest, analyze, understand and
communicate what it all means.”
Nor do pretty dots always have statistical significance in
terms of the number of detections obtained from each release group within
certain regions of the Delta. Only a tiny percentage of any fish cohort gets
tagged due to costs. Vanishingly few of those are detected as far as the Delta
or pumps. Vallee worries that a lack of detection data will be used by water
managers to approve exports. “It’s the fox guarding the henhouse,” he says.
In times of crisis, like extreme droughts, any insights into
where endangered salmon are located can be valuable. Consider what happened
during the 2015 drought. Declining water quality in the interior Delta
threatened the water supply pumped to the San Joaquin Valley. Water managers
knew they could boost freshwater levels by opening the Delta Cross Channel
gates in Walnut Grove to allow Sacramento River water to improve conditions.
Yet opening the channel can pull endangered outmigrating winter-run salmon on
an often fatal detour through the interior Delta.
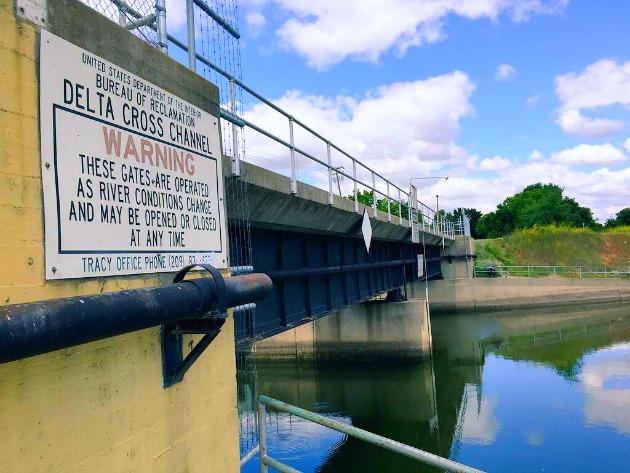
Delta Cross Channel. Photo courtesy KCET
Throughout that drought year, administrators kept asking
about the location of the troubled runs. Data from tagged fish and real-time
receivers kept them informed. “Having the data and models to see what’s going
on now is helpful when decision makers are confronted with balancing fish and
water,” Johnson says.
This scenario would only happen in an emergency. “Acoustic
tagging data isn’t used regularly to operate the Cross Channel because tagged
fish are released after we’ve closed the channel to protect passing salmon,”
Israel says. “The only time we may deviate is when the state and federal water
projects are at risk of not meeting Bay-Delta water quality standards.”
Vallee feels several additional technologies could help
inform water and fisheries management in the Delta. These include split-beam
sonar, which detects the air in fish bladders to count animals but doesn’t
identify species, and acoustic cameras, which are towed behind a boat and
automatically image any fish that pass through their sound beams. A video
version of the latter, dubbed SmeltCam, is already being used to study the
fragile Delta smelt.
Overall, this ambitious analytical endeavor is still
evolving in terms of being able to answer management questions. The number of fish tags and receivers being deployed is
steadily increasing, making sample sizes more representative. And new data
filters are able to discern when tags have been eaten by predators.
“We’ve also made a lot of progress educating
managers and exporters about how to use our statistical models to confirm the
error range of the real time results,” says USGS Project Chief Jon Burau. “So
if we can ramp all this telemetry analysis up, and combine it with really large
scale restoration of dendritic tidal channels, the fish will have half a
chance.”
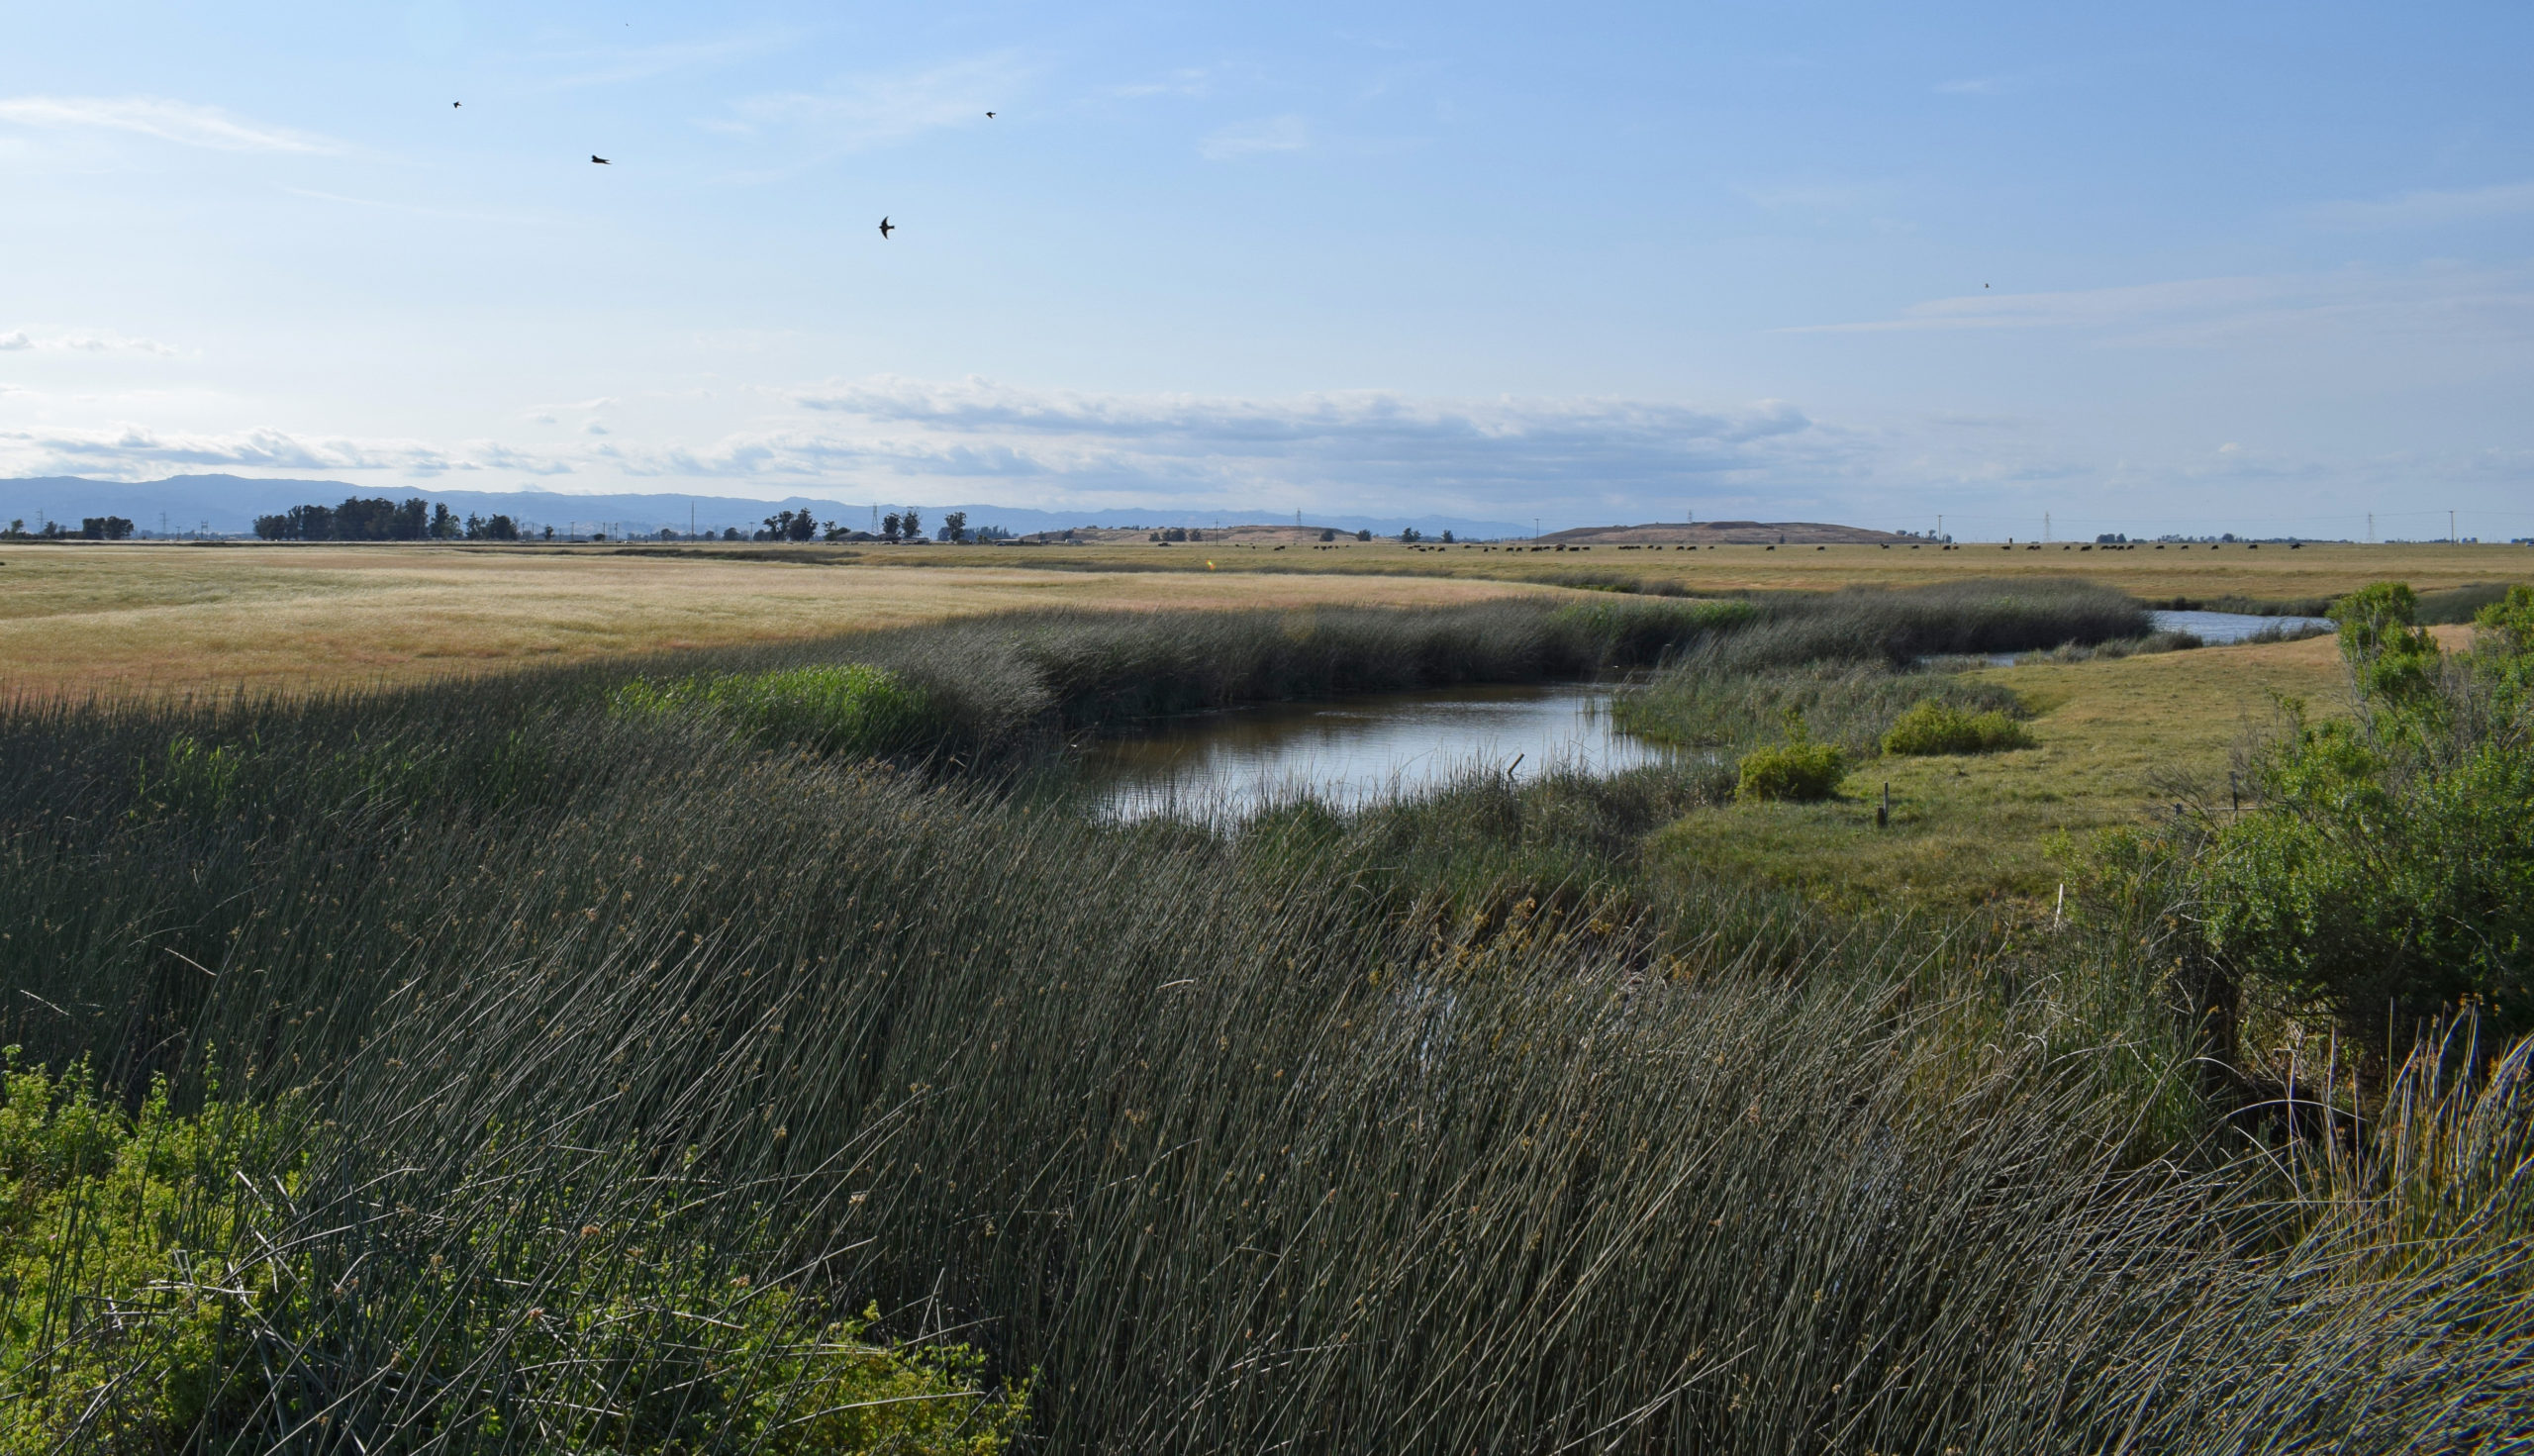
Smaller tidal channels around Lindsey Slough offer food-rich locations for growing fish. Photo: Amber Manfree
Real-time data: an emerging experiment
Current wildlife and water policies explicitly embrace the
use of real-time telemetry data, even as many scientists retain a healthy
skepticism about outcomes.
“The policy landscape is allowing more flexibility in
decision-making based on current conditions versus calendar-based ones,” Perry
says. “People see value in trying to manage for the complexity around water
reliability and fish based on what is happening.”
“Having the fish movement data
integrated with other information about the environment, and maintaining this
array over years and years, gives scientists the chance to get a full picture,
over time, of how fish use the system,” says Louise Conrad, Deputy
for Science for the Delta Stewardship Council.
“Sociologically, it improves our ability to communicate
among our different tribes, and that’s a good thing,” says IEP’s Culberson. “It
has moved the needle on what we know and given a sense of pride to the people
doing the work, because they are solving problems.”
“We’re Californians.
We’re Delta folk. We’re fishermen. We’re water users,” says Vallee. “We want
decisions to be made with the most accurate data, as precisely and truthfully
as possible.”
Bay Area native Kathleen M. Wong is a science writer specializing in the natural history and environment of California and the West. With Ariel Rubissow Okamoto, she coauthored Natural History of San Francisco Bay (UC Press, 2011), for which she shared the 2013 Harold Gilliam Award for Excellence in Environmental Reporting. She reports on native species, climate change, and environmental conditions for Estuary, and is the science writer of the University of California Natural Reserve System.
Our magazine’s media motto for many years has been “Where there’s an estuary, there’s a crowd.” The San Francisco Estuary is a place where people, wildlife, and commerce congregate, and where watersheds, rivers and the ocean meet and mix, creating a place of unusual diversity. In choosing to tell the...
Ever since the state and federal water projects were built in the 1930s and 1940s, California has captured snowmelt in foothill reservoirs, and moved the fresh water from dam releases and river outflows to parched parts of the state via aqueducts hundreds of miles long. A convoluted system of ancient...
Though the Clean Water Act did an amazing job of reducing wastewater and stormwater pollution of the San Francisco Estuary, some contaminants remain thorny problems. Legacy pollutants like mercury washed into the watershed from upstream gold mining, PCBs from old industrial sites, and selenium from agricultural drainage in the San...
Hothouse Earth
By Ariel Rubissow Okamoto
Photo by Megan Nguyen
Nothing could be stranger than sitting in the dark with thousands of suits and heels, watching a parade of promises to decarbonize from companies and countries large and small, reeling from the beauties of big screen rainforests and indigenous necklaces, and getting all choked up.
It was day two of the September 2018 Global Climate Action Summit in San Francisco when I felt it.
At first I wondered if I was simply starstruck. Most of us labor away trying to fix one small corner of the planet or another without seeing the likes of Harrison Ford, Al Gore, Michael Bloomberg, Van Jones, Jerry Brown – or the ministers or mayors of dozens of cities and countries – in person, on stage and at times angry enough to spit. And between these luminaries a steady stream of CEOs, corporate sustainability officers, and pension fund managers promising percentages of renewables and profits in their portfolios dedicated to the climate cause by 2020-2050.
I tried to give every speaker my full attention: the young man of Vuntut Gwichin heritage from the edge of the Yukon’s Arctic National Wildlife Refuge who pleaded with us not to enter his sacred lands with our drills and dependencies; all the women – swathed in bright patterns and head-scarfs – who kept punching their hearts. “My uncle in Uganda would take 129 years to emit the same amount of carbon as an American would in one year,” said Oxfam’s Winnie Byanyima.
“Our janitors are shutting off the lights you leave on,” said Aida Cardenas, speaking about the frontline workers she trains, mostly immigrants, who are excited to be part of climate change solutions in their new country.
The men on the stage, strutting about in feathers and pinstripes, spoke of hopes and dreams, money and power. “The notion that you can either do good or do well is a myth we have to collectively bust,” said New Jersey Governor Phil Murphy whose state is investing heavily in offshore wind farms.
“Climate change isn’t just about risks, it’s about opportunities,” said Blackrock sustainable investment manager Brian Deese.
But it wasn’t all these fine speeches that started the butterflies. Halfway through the second day of testimonials, it was a slight white-haired woman wrapped in an azure pashmina that pricked my tears. One minute she was on the silver screen with Alec Baldwin and the next she taking a seat on stage. She talked about trees. How trees can solve 30% of our carbon reduction problem. How we have to stop whacking them back in the Amazon and start planting them everywhere else. I couldn’t help thinking of Dr. Seuss and his truffala trees. Jane Goodall, over 80, is as fierce as my Lorax. Or my daughter’s Avatar.
Analyzing my take home feeling from the event I realized it wasn’t the usual fear – killer storms, tidal waves, no food for my kids to eat on a half-baked planet – nor a newfound sense of hope – I’ve always thought nature will get along just fine without us. What I felt was relief. People were actually doing something. Doing a lot. And there was so much more we could do.
As we all pumped fists in the dark, as the presentations went on and on and on because so many people and businesses and countries wanted to STEP UP, I realized how swayed I had let myself be by the doomsday news mill.
“We must be like the river, “ said a boy from Bangladesh named Risalat Khan, who had noticed our Sierra watersheds from the plane. “We must cut through the mountain of obstacles. Let’s be the river!”
Or as Harrison Ford less poetically put it: “Let’s turn off our phones and roll up our sleeves and kick this monster’s ass.”
4th California Climate Change Assessment Blues
by Isaac Pearlman
Since California’s last state-led climate change assessment in 2012, the Golden State has experienced a litany of natural disasters. This includes four years of severe drought from 2012 to 2016, an almost non-existent Sierra Nevada snowpack in 2014-2015 costing $2.1 billion in economic losses, widespread Bay Area flooding from winter 2017 storms, and extremely large and damaging wildfires culminating with this year’s Mendocino Complex fire achieving the dubious distinction of the largest in state history. California’s most recent climate assessment, released August 27th, predicts that for the state and the Bay Area, we can expect even more in the future.
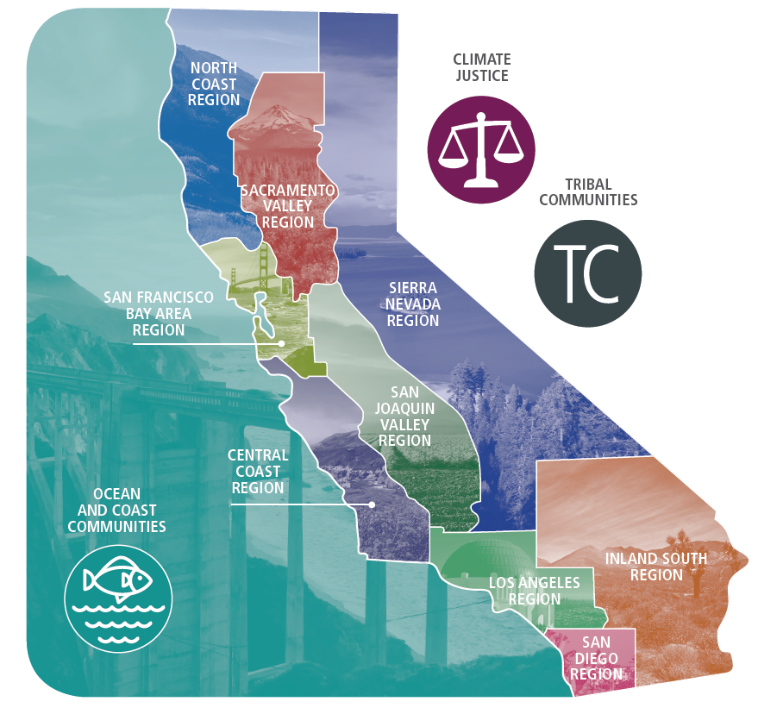
The California state government first began assessing climate impacts formally in 2006, due to an executive order by Governor Schwarzenegger. California’s latest iteration and its fourth overall, includes a dizzying array of 44 technical reports; three topical studies on climate justice, tribal and indigenous communities, and the coast and ocean; as well as nine region-specific analyses.
The results are alarming for our state’s future: an estimated four to five feet of sea level rise and loss of one to two-thirds of Southern California beaches by 2100, a 50 percent increase in wildfires over 25,000 acres, stronger and longer heat waves, and infrastructure like airports, wastewater treatment plants, rail and roadways increasingly likely to suffer flooding.
For the first time, California’s latest assessment dives into climate consequences on a regional level. Academics representing nine California regions spearheaded research and summarized the best available science on the variable heat, rain, flooding and extreme event consequences for their areas. For example, the highest local rate of sea level rise in the state is at the rapidly subsiding Humboldt Bay. In San Diego county, the most biodiverse in all of California, preserving its many fragile and endangered species is an urgent priority. Francesca Hopkins from UC Riverside found that the highest rate of childhood asthma in the state isn’t an urban smog-filled city but in the Imperial Valley, where toxic dust from Salton Sea disaster chokes communities – and will only become worse as higher temperatures and less water due to climate change dry and brittle the area.
According to the Bay Area Regional Report, since 1950 the Bay Area has already increased in temperature by 1.7 degrees Fahrenheit and local sea level is eight inches higher than it was one hundred years ago. Future climate will render the Bay Area less suitable for our evergreen redwood and fir forests, and more favorable for tolerant chaparral shrub land. The region’s seven million people and $750 billion economy (almost one-third of California’s total) is predicted to be increasingly beset by more “boom and bust” irregular wet and very dry years, punctuated by increasingly intense and damaging storms.
Unsurprisingly, according to the report the Bay Area’s intensifying housing and equity problems have a multiplier affect with climate change. As Bay Area housing spreads further north, south, and inland the result is higher transportation and energy needs for those with the fewest resources available to afford them; and acute disparity in climate vulnerability across Bay Area communities and populations.
“All Californians will likely endure more illness and be at greater risk of early death because of climate change,” bluntly states the statewide summary brochure for California’s climate assessment. “[However] vulnerable populations that already experience the greatest adverse health impacts will be disproportionately affected.”
“We’re much better at being reactive to a disaster than planning ahead,” said UC Berkeley professor and contributing author David Ackerly at a California Adaptation Forum panel in Sacramento on August 27th. “And it is vulnerable communities that suffer from those disasters. How much human suffering has to happen before it triggers the next round of activity?”
The assessment’s data is publicly available online at “Cal-adapt,” where Californians can explore projected impacts for their neighborhoods, towns, and regions.


 The results are alarming for our state’s future: an estimated four to five feet of sea level rise and loss of one to two-thirds of Southern California beaches by 2100, a 50 percent increase in wildfires over 25,000 acres, stronger and longer heat waves, and infrastructure like airports, wastewater treatment plants, rail and roadways increasingly likely to suffer flooding.