Beyond the Bag Ban
by Ariel Rubissow Okamoto
The other day I found myself turning out the closets for one last plastic bag. Dreaming of those white Safeway sacks as I searched for something to sequester what may well be the most toxic contaminant in the homes and cars of many a modern family: freshly used soccer cleats.
But a year into San Francisco’s bag ban, there just aren’t that many plastic shopping bags around our house anymore. All told, 60 percent of municipalities in the four most urbanized Bay Area counties have banned them, and 40 percent went as far as to outlaw their polystyrene counterparts, known as “clamshells” in the trade.
It’s all part of a substantial endeavor by regional regulators and 76 local municipalities to stop several priority pollutants — litter, PCBs and mercury among them — from getting into our creeks and Bay via stormwater runoff. Their actions — from the bag bans to installing trash capture devices in storm drains, identifying PCB hot spots, and jackhammering concrete to make way for more absorbent greenery — have yielded measurable reductions in some pollutants. They’ve also yielded some lessons that could shed more daylight on stormwater management.
“It’s no longer going to be an underground, out-of-sight, out-of-mind approach, we’ll need to better integrate water quality concerns with urban redevelopment and aesthetics in the future,” says Chris Sommers of EOA, Inc., a consultant for Santa Clara Valley’s stormwater program.
It wasn’t so long ago that the average local citizen had no idea the drain in their street led to the Bay. “Twenty years ago we were still focused on basics like controlling runoff from construction sites with hay bales and silt fences,” says engineer Matt Fabry, who coordinates San Mateo County’s water pollution prevention program. “We’ve learned a lot since then. Right now we’re on the verge of another big shift in the way we think about managing stormwater. We’re looking at redoing our entire urban drainage system. Since these systems took 100 years to build, we can’t expect to change them overnight.”
Photo: Ariel Okamoto.
“Municipalities and regional agencies are big ships, it can take decades to make significant changes in direction,” adds Sommers. Fortunately, a major incentive in the form of the Clean Water Act forced agencies to start charting a new course.
Their first course correction began in 1990, when regulators asked municipalities to prepare urban runoff management plans and tend to tasks such as sweeping streets, inspecting drains and training city maintenance staff to go light on the pesticides. Next, the San Francisco Bay Regional Water Quality Control Board engaged them in doing their part to address regional load limits for trash, PCBs, mercury, sediment and pesticides.
Preliminary studies had shown that these pollutants were so ubiquitous across the urban landscape they required coordinated management under the nation’s first ever “regional” municipal permit for the discharge of stormwater to state waters. Under the 2009 permit, 76 of the bigger urban municipalities (within Contra Costa, Alameda, San Mateo, Santa Clara counties, as well as the cities of Vallejo and Fairfield) attempted to collaborate on the task. Key to this collaboration was leadership on the part of the Bay Area Stormwater Management Agencies Association (BASMAA), support on watershed planning and trash capture from the San Francisco Estuary Partnership, and technical and scientific insight from the San Francisco Estuary Institute (SFEI).
This winter, regulators are poised to propose a second five-year regional permit, now that they’ve seen “some but not enough” progress on staunching the flow of polluted runoff to the Bay, according to the Water Board’s Thomas Mumley. “We’ve learned that an effective permit requires flexibility for the good actors and enforceability for the bad actors. The new permit will include more specificity and accountability.”
Today, it’s clear the Bay Area is both on the cutting edge of stormwater management nationwide, and faced with serious obstacles to compliance, the biggest of which may be money. “We’ll give people time if they give us commitment,” says Mumley.
TESTING TESTING
Under the first five-year permit, municipalities began by narrowing down which areas deserved attention. Based on samples taken from 17 bottom-of-the watershed drains through the Regional Monitoring Program, as well as on-the-ground expert opinion, half a dozen watersheds were selected for PCB and mercury experiments with a variety of management techniques and five for deeper sleuthing in the search for hidden sources of contamination.
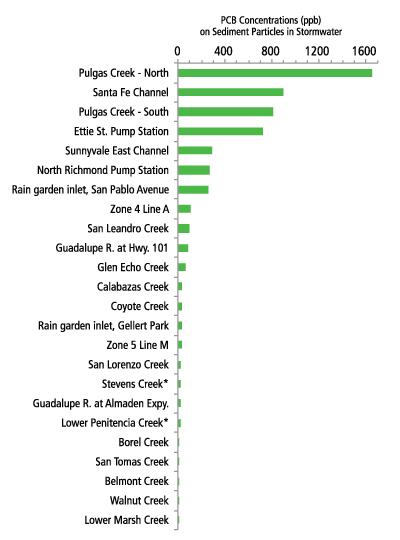
“Generally when we go looking, we find something, and anytime you find a true source of pollution it’s good for the environment,” says technical team leader Lester McKee, a geologist with the San Francisco Estuary Institute. “We needed to know where to apply management techniques, which techniques worked best, and what mass of our target contaminant we could expect to capture, remove, or mitigate with our efforts.”
Existing land use offered strong cues for where to find the most mercury, PCBs, trash, and other bad actors. “An acre of old industrial is going to produce a lot more PCBs than an acre of new residential,” says Sommers. “It seems like a no-brainer, but we didn’t have the data to support management action in those areas until now.”
In the meantime, the permit goal was to test a variety of management approaches including ID of source properties, treatment, and inspection of industrial materials and equipment. The success of some existing programs also came under more scrutiny. Ramped up monitoring has begun, for example, to assess the benefits of an experiment in which the City of Palo Alto is rerouting half a million gallons of runoff – the first dirty flush through the storm drain after a dry spell – to its wastewater treatment plant.
One place the push for source ID led the Santa Clara Valley program to was Leo Avenue. In the storm drain running down the middle of this industrial culde- sac in San Jose, scientists found very high levels of PCBs (10 parts per million, 1,000 times higher than levels typically found in the Bay). The avenue abuts an old Union Pacific rail line and a dozen private properties, among them auto wrecking and recycling yards. Testing in all these areas revealed that the PCBs were coming from the rail line and the mercury from the auto yards. Given the number of unmentionables spilled or spread along rail lines, in particular dust suppressing oils, this is not surprising. The question now is how to approach the railroad, and to tackle a source that could well ring most of the South and East Bay, let alone one little cul-de-sac.
In the meantime, the City of San Jose conducted two “in-line” test clean-outs of the storm drain to remove the most contaminated sediments. Going forward, “the trick will be to find enough problem properties to achieve the additional reductions in PCBs required by the new permit,” says Sommers.
Some of the sleuthing for other more highly polluted watersheds turned up a surprise – a small tributary to Alameda Creek called Zone 5, Line M with unusually high levels of mercury and flame retardants. “This tells us there must be a source upstream, and helps to confirm that our sampling design is robust enough to sort out cleaner versus dirtier spots,” says McKee.
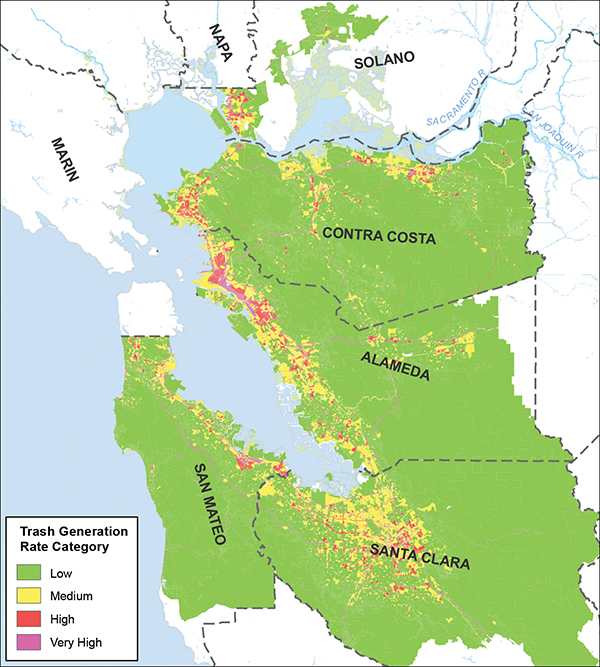
For trash, land use also offered important cues. BASMAA found that high-density retail and commercial sections of cities produce the most trash, especially those in lower income neighborhoods. Municipalities collected enough data to actually map high, moderate and low trash generation areas. The high and moderate areas currently amount to over 170,000 acres (see map). With this information in hand, municipalities launched a range of actions, from outreach to fast food restaurants to engaging youth in creating trash awareness videos to “interception.”
To intercept trash on the ground before it travelled further downstream, the region installed 4,003 trash capture devices, which now “treat” more than 20,000 acres. The program, managed by the Estuary Partnership, was underwritten by a $5 million grant from the American Resource and Recovery Act. And for all the bags and foam food boxes and water bottles that still, despite these efforts, did end up in our creeks and shorelines, permittees conducted clean ups and actively supported Save the Bay and Coastal Commission efforts on this front too.
While Sommers is pleased with all the progress on trash, he sees inefficiencies. “I worry that we’re spending too much time and money operating stormwater treatment facilities and trash capture devices at a municipal level, as opposed to really getting back to locating sources and changing behavior,” he says. The latter two activities promise to come into play in a bigger way when the region attempts to comply with the next five-year permit, which will ratchet the trash reduction target up to 70 percent from 40 percent.
“Ultimately we’re not asking for pristine streets, we’re asking that they take their very high and medium trash generation areas and manage them so that they are all low or better. That’s trackable in terms of amount of area managed,” says Mumley. Such tracking might benefit from a new trash app — where citizen monitors can survey local hot spots with phone cameras.
GREENING THE GREY
As stormwater so indiscriminately collects whatever’s on the street or lot or yard and delivers it to the Bay, it’s no wonder everyone is so jazzed about turning the acres of grey to green. Whether you call it “green infrastructure” or “low impact development,” the idea is to soften up the surfaces of our cities with more soil and plants. The beauty of these landscape interventions is they not only add greenery to our cities, but also slow down runoff, let water percolate back into the ground, trap sediments, and filter more than one kind of contaminant.
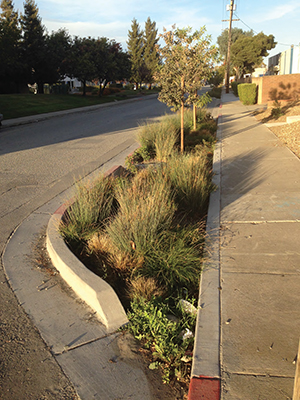
Photo courtesy Matt Fabry
Designs for green LID range from bulb outs at street corners and tree wells in sidewalks to bioswales and raingardens. In technical terms, McKee describes this new generation of water collection units as “a hole dug in the ground, either lined or unlined, usually with a perforated sub-drain at the native soil interface that has a gravel layer, a compost layer, and mulch or soil media sitting on top where plants can grow, and which drains a streetscape or industrial site.”
Under the first five-year permit, municipalities added at least ten pilot projects to the Bay Area’s existing green infrastructure – most of them no bigger than half a block or a hole in the sidewalk. On Bransten Avenue in San Carlos, a light industrial area identified as having high PCBs, permittees created eight pervious new bulbs along the sidewalk. While a positive first step, these small green spots cannot begin to capture and filter the runoff from the much larger private properties around them. So while greener streets can be an easy first step in a public right of way, the next step must be onto private property.
In the meantime, preliminary tests confirm that this popular dual duty kind of landscaping delivers the intended result. McKee’s team has been rushing out at the first sign of rain every year to sample the water and sediments coming down the gutter into these new units and also what’s coming out the other end. According to McKee, our typical Bay Area green LID units are doing a pretty good job of capturing sediment, PCBs and pesticides, and even a little lead. They aren’t capturing as much mercury, however, except in the worst watersheds. “When we put green LID in a dirtier place — a place that’s more industrial or has higher concentrations in the source catchment — we get better performance,” says McKee.
McKee’s team is currently testing a new prototype device that could enable him to collect and test stormwater from 100 rather than just 20 problem watersheds in the coming years. This passive device could save both money and staff time chasing storms.
NO PAY DIRT FOR OVERHAULS
As the second regional permit takes shape there’s growing buy-in among municipalities that green LID is the preferred path to compliance, says Mumley. The challenge will be to do more of it over bigger areas with less money. One promising frontier for growth is transportation, where there has been a flurry of activity around adding bike lanes, transit options, and high-density development to combat greenhouse gas emissions. Fabry would like to see these upgrades include more porous infrastructure.
“We’re going to have to go out there and retrofit our roadways, which are still one of the dirtiest parts of our impervious acreage,” he says. “So with such limited local funding for stormwater, and more dollars for transportation, it makes sense to make this a walkable, livable communities initiative rather than just a water quality initiative.”
The new regional permit will likely require green infrastructure master plans for each city and county. A new SFEI tool could help identify target streets and areas for green infrastructure based not only on pollution problems but also local hydrology, land use, and available right-of-way. “Nearly every city will need to develop a plan to integrate green infrastructure into their overall development practices and city general plans,” says Sommers.
In the end, like most of the big infrastructure replacement and ecosystem restoration projects biding their time around the Bay margins, all of this will take big bucks no one seems to have in local pockets. Propositions 13 and 218 continue to limit county fundraising through property-related fees or taxes, and several local measures that would have pushed the envelope have foundered. “We’re not going to be able to get this multi-decadal transformation if we don’t have a big influx of outside money — federal or state funds,” says Fabry. “We need to come in with our local pot of money and attach it to greenhouse gas reduction dollars and cap-and-trade revenue and get it all done at same time.” At least climate change and the drought have given storm water a new look as an untapped source of scarce fresh water.
Experts believe that if any reshaping of how we fund big ticket items like water supply, flood control and stormwater management is going to happen on the state level it will be within the next four years while Governor Brown is still in office.
“It’s time to move beyond just trying to get people to understand that their storm drains flow right into the Bay, untreated, to building a willingness in our communities to support green infrastructure initiatives, both in spirit and with dollars,” says Mumley.
RELATED LINKS:
Stormwater Talks from Session 2 of 2014 RMP Annual Meeting
History of the First Municipal Regional Stormwater Permit
Water Board Stormwater Program
NEXT ARTICLE: Two-Way Threats to Intakes and Outfalls


 The results are alarming for our state’s future: an estimated four to five feet of sea level rise and loss of one to two-thirds of Southern California beaches by 2100, a 50 percent increase in wildfires over 25,000 acres, stronger and longer heat waves, and infrastructure like airports, wastewater treatment plants, rail and roadways increasingly likely to suffer flooding.